|
|
|
|
|
Color Map Editor

The Color Map Editor Window Index
The Map
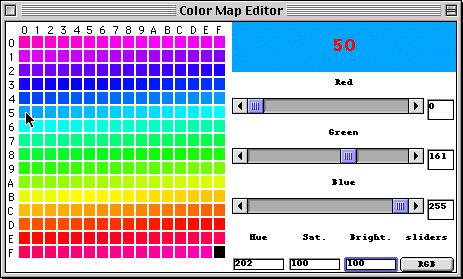
The color map is a set of 256 colors in which the fractal you draw is displayed. It is the means by which the numbers generated by the loop functions for the various pixels in the fractal image get changed to a color. Depending on the Color Cycles value the various numbers from 0 to depth are converted to the successive colors in the map. Only the value depth itself is converted to the last color at FF.
Each position in the color map has a two character designation; the first character is for the row and the second for the column. The mouse in the picture above is pointing to position 50.
You can place any color you like at any position using the items on the right side of the color map editor. Click on a colored square in the left of the window. That selects it for editing. You can also select a color for editing by clicking on a drawing window's fractal picture.
Selected Color Display
When you select a color in the color map it appears in the large rectangle at the upper right of the color editor window. Its position in the color map is written in the middle of the rectangle in a contrasting color. This lets you see a big patch of the color you are working on and reminds you where it is.
Sliders and Values
Every color on your computer's screne is composed of some red, some green, and some blue (or possibly none of them). You can change the selected color to anything you want by changing the amounts of red, green, and blue. This can be done with the sliders or with the numbered boxes.
Values in the boxes range from 0 for none of that color to 255 for as much of the color as possible. Press the "return" key to make the number you type take effect.
When you change the amount of red, green, or blue you will, presumable, see changes. The selected color box above the controls will change to the new color. The little square to the left in the color map display will change too. And, most importantly in many cases, the fractal in the active drawing window will change too.
RGB vs HSB Button
While all the colors can be thought of as red, green, blue combinations, sometimes it is more convenient to think of colors as conisiting of a hue, saturation and brightness. Hue corresponds to the frequency of normal light, the position in the rainbow you might say. Values are usually thought of in terms of degrees of a circle (0 to 360) on a color wheel. Saturation is a measure of how much of the color is there, as opposed to just being a shade of grey. Values range from 0 for grey to 100 for full strength color. Brightness is the amount of light present, or what shade of grey you"d have if the saturation were zero. Values range from 0 to 100 here to.
The little button in the lower right hand corner of the color map editor window allows you to switch what the sliders and the number boxes to their right represent. Try clicking it. The labels for the sliders will change and the button itself will say "HSB". Click it again and everything will change back to RGB.
The setting of this button also affects the way colors are ramped by the ramping items in the "Tools" menu.
Bottom Boxes
If the sliters are set to RGB you can still enter HSB values in the bottom boxes. If the sliders are HSB you can enter RGB there.
|
|
|